
Data carpentry, "long" data from library databases & other data related topics


When I first started in academic libraries, one of the most popular questions I got was "what database should I use to find articles on X". Today ten years later, I still get such questions but to a far lesser degree.
This is due to a combination of better discovery from all in one tools like Google Scholar, various library discovery services and just more digital material out there that is much more findable.
Today the questions I tend to get often are of a different nature.
Where can I find panel data on X? How do I download large amounts of data (or even scrape the data from a website) in the most efficient way? How do I combine dataset X with Y and/or do other data manipulations? How do I run regressions on them or visualize the results?
This requires a whole host of different skills beyond merely constructing keywords and searching mostly text databases.
So in response to this, I have been trying to learn in my own way the various skills on how to handle data, but let me share with you some interesting resources I have discovered lately.
Data Organization in Spreadsheets - Data Carpentry lesson
One of the best places to learn data skills for academic research is the Data Carpentry website and the associated software carpentry and library Carpentry websites.
Most of the lessons on these sites are pretty similar and in general the following are introduced at a beginner level.
Git for version control of data
SQL for querying of data
Openrefine for data cleaning (I've mentioned openrefine quite a bit this year on my blog),
R, Python, Bash/grep - for data manipulation/wrangling , simple statistical analytics and visualization
Some data scraping and text visualization (using CSS selectors or Xpath)
I've tried most of them and the quality is excellent.
If all these terms intimidate you, you might still want to first take a look at the lesson "Data Organization in Spreadsheets" or "Tidy data for librarians" which is definitely accessible to anyone as all in does is to talk about use of spreadsheets aka Excel.
Despite this please don't underestimate the amount of useful and practical advice packed into these lessons.
They cover common mistakes, good practices for structuring data and provides some of the best explainations I have read on the difficulties of handling dates in Excel and provide suggestions on how to deal with them.
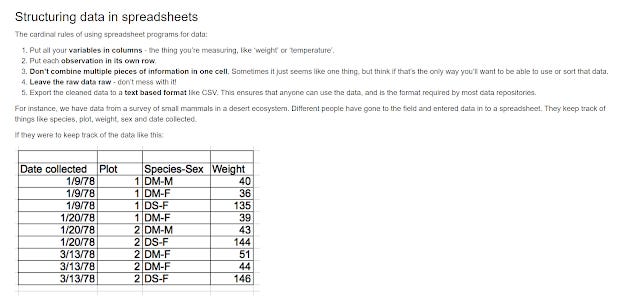
Sample of lesson and advice on structuring data in spreadsheets
There's a nice discussion of why you should always record zeros and how it differs from a "null" value (a lesson I find many people don't get) and even provides a nice table on what symbols are best to denote a null value.
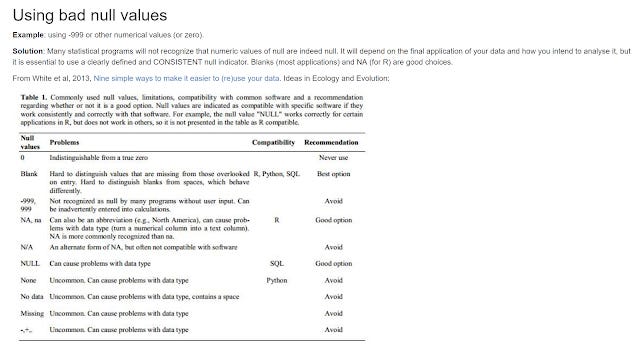
Good null values
The lesson plan also I think demostrates good pedagogy. The instructor isn't suppose to lecture the class on all the common errors at the start.
Instead, the students will first download a "messy" provided dataset and they are supposed to try to critique the dataset and based on the responses the instructor will expand on the issues identified.
Overall, this is an excellent lesson. While it is likely that if you have done a lot of data projects, you will eventually start to figure out most of this by trial and error, for fresh new students or even postgraudates just starting on their research, this lesson should prove helpful.
Tidy data - Long data vs Wide data
I was having a talk with a faculty recently, and he complained to me that most of the financial databases we have couldn't pull out the data he wanted in the layout he wanted.
While he was talking to me, something clicked. A few months ago while messing around with R and in particular the R package, Tidyr - I came across the concept of "tidy data".
To simplify, tidy data is when
a) Every row is a observation
b) Every column is a variable
In fact, if you look at the lesson I mention earlier, they recommend this as well, without really going in depth.
In fact, Tidy data is also almost always in the "long format" compared to the "wide format" and there are good reasons why the former is recommended.
Confused? I was. Here's an illustration.
Say I'm want to find the closing stock price over 3 days for 3 Equities A, B, C.
Most databases I find give me the following, which is in the "Wide" format.
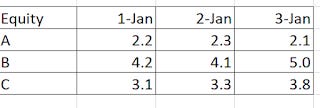
What I usually get from databases - wide layout
Note that this data is in the wide format and isn't tidy. In this toy example, date is a variable, so to be tidy there should be a column for date and lastly for stock close price as opposed to currently where you have columns like closing stock price @ 1-Jan, closing stock price @ 2- Jan and closing stock price @3-Jan.
So what should you want instead? Instead, the following layout is what you should want to get.
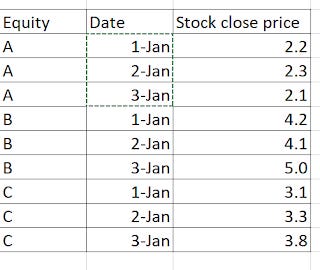
Long data - tidy data
Intutively, I suspect many people would find this layout odd, as each Equity is repeated 3 times for each of the 3 dates and you get 9 rows X 3 columns = 27 cells instead of the usual way, which yields you 3 rows x 3 columns which is 9 cells and hence has less to record.
However, the "long" format actually makes sense if you think in terms of firm-date (or firm-years) where each observation is a row of data. So closing stock price of A on 1 Jan, would be plotted seperately from closing stock price of A on 2 Jan and in this study you get 9 data points, allowing you to more easily do statistical analysis such as regressions.
Also if say you added more variables like total market capitalization, in the long data format it would be just one more column, but in the case of the wide format, it would be 3 more confusing columns on top of the ones for closing stock price already. (market capitalization@ 1 Jan, market capitalization 2 Jan, market capitalization@ 3 Jan).
It's actually a lot more complicated than this, if you are interested you can read the classic paper Hadley Wickham paper on this.
How easy is it to natively output data in long format?
It's somewhat interesting to me that with most financial databases getting the data output in the "long data" format isn't particularly easy.
I managed with Eikon (even though the steps were really uninitutive), but so far have no luck with Capital IQ (to be fair I didn't have access to the plugin for this one) and Datastream.
With bloomberg you can sort of do it by having one column with the equity and one column with the dates and then using the BDH formula e.g
=BDH("A1","px_last", "B2", "B2")
where B2 is the cell with the dates and A1 the cell with the equity.
But that works only for one equity and typically, my researchers are mass downloading hundreds if not thousands of equities in bulk.
How easy is it to format the data into the long format?
Of course, even if I managed to figure out how to pull out the data in the format I wanted for one database, it might not work for another. (Sidenote: So far I couldn't figure out how to pull out such data in the long format except for in Eikon. Bloomberg, CapitalIQ gave me the data in the width format despite my best efforts which kinda surprised me)
So perhaps it's better to figure out a generic way to convert data from any format to the long format.
Using the pivot table Wizard in Excel
It's actually surprisingly difficult. First off a simple transposition in Excel isn't going to work. The solution for Excel appears to be to use the "consolidated ranges" in the Pivot table wizard to achieve this.
The main problem with this is while this works for small datasets, if you try this on a large dataset, Excel will crash as you will be trying to create a very large pivot table.
So for example, I tried using this to convert 700 equities and 260 columns of closing stock price to the long format, and Excel crashed.
Using the free Tableau Excel Plugin
Another solution, I've found is to use the free Tableau Excel plugin to reshape the data. As far as I can tell you don't need Tableau installed and is capable of handling bigger data sets than the above method.
Using openrefine
Another option is the trusty Openrefine using the tranpose option.
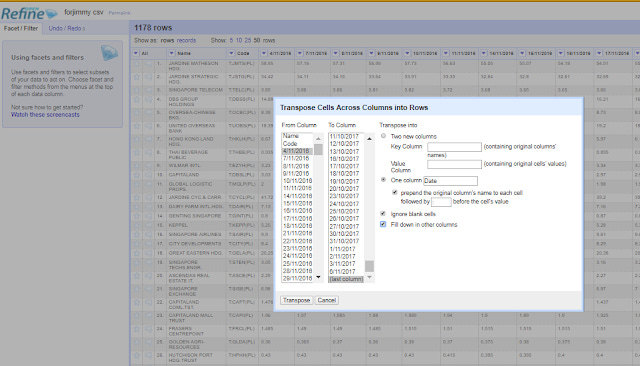
Select Transform-> Transpose cells across columns into rows-> Check "Into one column with options prepend the original column's name to each cell followed by :" and also Check "fill down in other colums".
Then split the resulting column by :
See also, Tony Hirst's "Data Shaping in Google Refine – Generating New Rows from Multiple Values in a Single Column".
Using R or Python
But if you are comfortable with non-Excel solutions in particular programming, one good way to do this is to use R, either with R's reshape package, or my preferred R tidyr package.
So in the above example, after loading the dataset and tidyr in R. The following will work
gather(datasetname, date, closing_stock_price, 2:4)
where datasetname is the name of the dataframe you uploaded into R, the next 2 variables are the column headings and 2:4 are the columns (first column = 1) to be put into rows.
You can also do it with Python of course but I'm not as comfortable with that.
Improvements to Publish or Perish and VOSviewer
Recently, two free and powerful tools available to Researchers were enhanced with powerful new features.
First tool that almost needs no introduction is Harzing's Publish Or Perish.
This software is famed for it's ability to scrape Google Scholar for bibliometrics (the only tool officially allowed by Google). Recently it added support for Microsoft Academic.
But 6.0, provides more new sources! Namely
Crossref
Scopus
Web of Science
Google Scholar Profile.
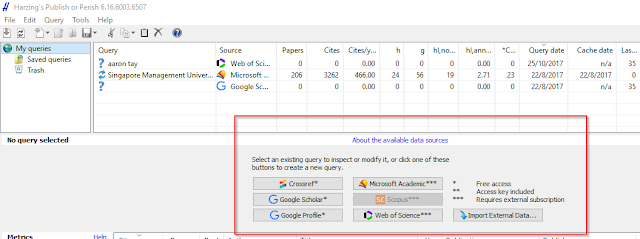
I've played with it a bit, currently Scopus doesn't seem to be working even with my API key.
The other tool that perhaps is lesser known is VOSviewer. I've reviewed it in a earlier blog post, it allows you to import data from Scopus or Web of Science to create bibliometrics networks. Think of it as a specialised Gelphi.
Version 1.6.6 adds the ability to use the Crossref API to pull data.
Conclusion
This has just been a sharing of the mix of data related ideas and tools, I have come across lately. Are any of this new to you?