Graph based applications for academic discovery - Citation graphs, PID research graphs, Knowledge graphs and more
As a academic librarian, iinterested in discovery, I have always been a bit skeptical about the value and usefulness of graph based techniques for enhancing discovery. Sure, they look cool, but are they actually useful?
Part of this belief stems from over-hyped but poorly implemented commericial search interfaces of the past that incorporate graphs as well as the failure of early library linked data efforts to capture the imagination.
I cover the following
Citation graphs e.g. scite
PID graphs/ Research graphs e.g.Project Feya's PID graph or OpenAIRE research graph
Cross domain knowledge graphs e.g. Wikidata & Google Knowledge Graph
Direct search engines for scholarly content e.g. Yewno Discovery & Ebsco new Concept maps feature
What follows is my attempt to try to make sense of linked data, citation graphs, knowledge graphs and other graph/web type implementations in academic discovery. Do note that my understanding of Linked data is limited to understanding what triples are (repeat after me "subject predicate object") , plus a limited understanding of RDF so as always take this whole essay with a big pinch of salt.
The problem with linked data applications and projects in the past
Among her others critiques is the fact that a lot of library linked data work at the time was exotic and technical in nature (building obtologies, data modelling) and of little interest to users trying to solve a real world task.
I don’t care about your ontology. I don’t care about anybody’s ontology, or data model, or graph, or whatever. I do not care. Why should I? We’ve done library work without ontologies and picture-perfect data models for hundreds of years, somehow or other. Can we just get off ontologies already?
Indeed as a librarian who started to attend various library conferences in the 2010s, I would dutifully attend seasons where presenters would go through the whole "What is a RDF triple" and then talk through stuff about their data model and ontology that inevitably bored the mind out of this librarian.
It was not just that the technical details was hard to understand, the applications mooted was simply unexciting. I could barely see why you would want to do all the hard work of doing linked data when the results were so mundane. (See also a similar critique by Jonathan Rochkind in 2015 where he suggests most library data i.e in MARC with the exception of holding and format data is probably not interesting enough to be worth expressing in Linked data to be linked to from the web)
That said, I have slowly started to come around to seeing the possible usefulness of some of these graph based techiques whether they are branded as semantic web, linked data or the now trendy Knowledge Graphs.
Citation graphs - clearest case of value
Citation graphs have always been easy for academic librarians like me to grasp the usefulness of for obvious reasons.
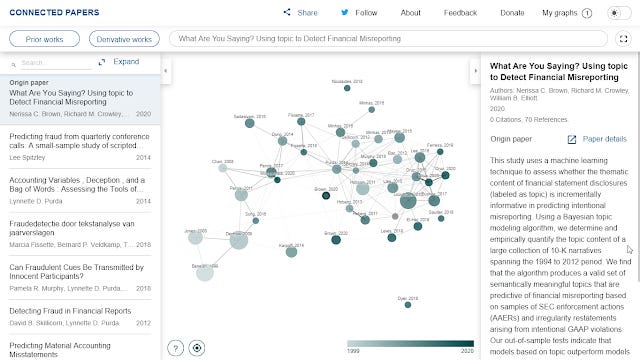
In recent years we have seen the rise in the open citation movement together with the general increase in open Scholarly metadata leading to interesting literature mapping, exploration and recommendation software like Citation Gecko, Connected Papers, PaperGraph and more joining existing bibliometric mapping software like VOSviewer and Citespace to help map literature review (note: some of these tools also use techniques beyond just citation relationships).
We have also started to see innovative work emerging from startups and Machine learning based companies like scite, Semantic Scholar that attempt to do more with citations by characterising the nature of the citation relationship beyond just calculating cited by (e.g working with citation contexts & sentiment analysis, see recent review paper on these topics).
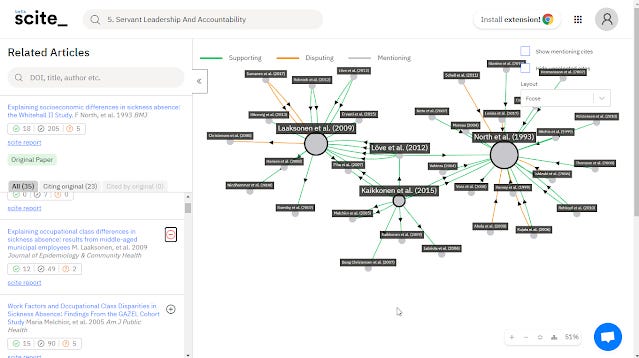
scite visualization of an article showing disputing and supporting cites.
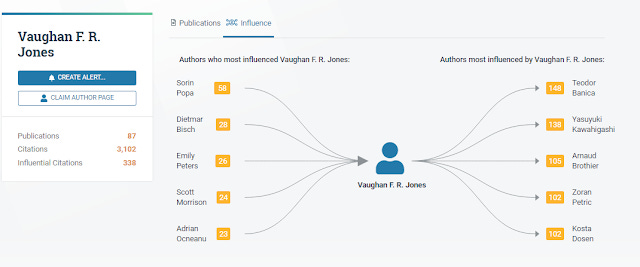
Semantic Scholar profile showing authors that influenced you and authors you influenced the most
But still such graphs are build primarily on citation relationships and are still pretty one dimensional and limited. Can we create more complicated graphs that are useful?
The rise of the Scholar Research PID graphs
One level up in complexity are Scholarly research graphs, and I first encountered the idea at a Crossref Live event on the possibility of a open map for Scholarly communications with the idea of an "article nexus" that linked article with Crossref dois to associated research output
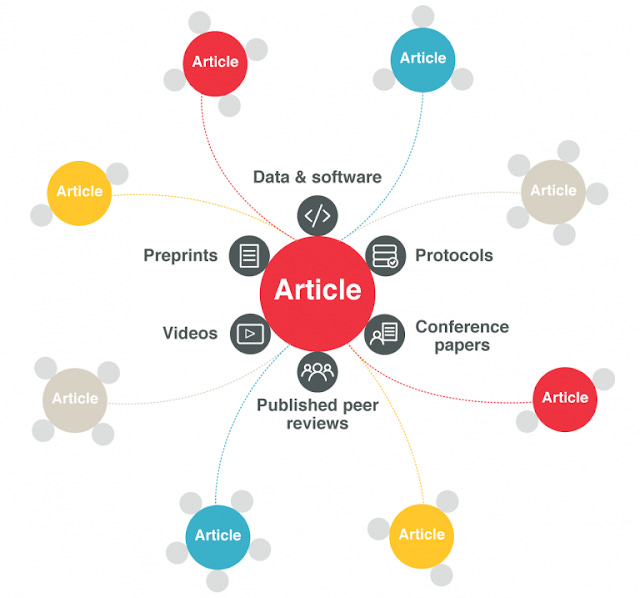
https://www.crossref.org/blog/the-article-nexus-linking-publications-to-associated-research-outputs/
Today, the concept has evolved into the idea of a PID graph or PID research graph.
This draws on the existing and growing PID infrastructure around research objects by creating a web/graph of PIDs by linking relationships between different PID types.
Some of these PIDs linked include - PIDs for
published articles (Crossref DOIs, the first large scale PID used in scholarly comunication)
authors (ORCID)
Organizations (ROR)
Datasets (Datacite dois)
Grants and funders (Crossref dois) with potentially more PIDs types on the horizon (e.g. software/code, Research facilities, Instruments)
FREYA PID graph
Typically these PID graphs or research graphes also leverage other commonly used dataset sources such as Unpaywall, Microsoft academic Graph, JISC CORE, PMC/Pubmed, GRID etc to further enhance the resulting graph with additional properties/relationships such as links to full text, open access status, versioning information and more.
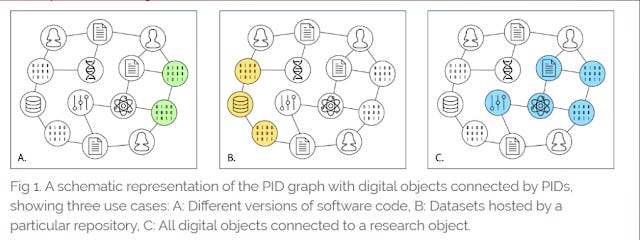
Project FREYA's PID graph is probably the example I am most familar with , but other examples of such research graphs exist including
Open Research Knowledge Graph (goes beyonds Freya PID graphs by creating relationships based on contributions of papers allowing automatic generation of tables that compare of papers)
ResearchGraph (Australia based)
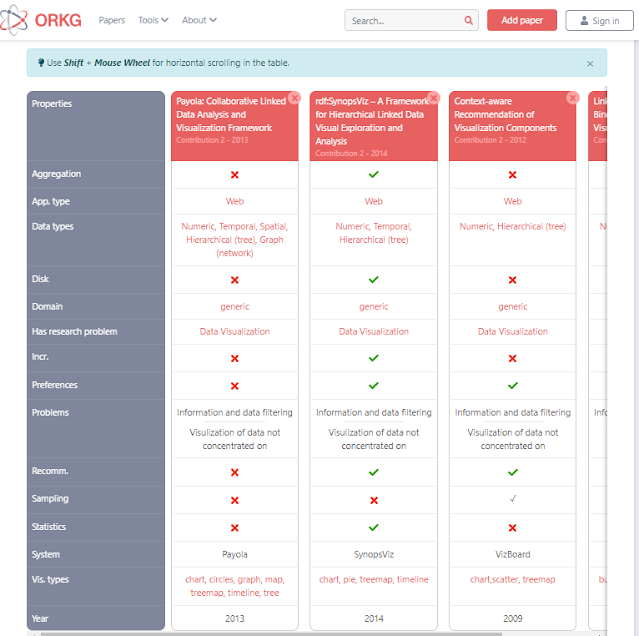
Open Knowledge Graph allows auto-generation of table comparisons by contributions
But are such research graphs useful?
Encouragingly the latest research graphs build around these lines such as Project Freya's PID graph as well as Open AIRE's research graph, have well defined user stories to ensure that what is being built can accomodate providing answers to queries that some users might want answered.
And indeed I can see how such research graphs can be useful for the monitoring and measurement of reseach activities by allowing you to run queries like show me all datasets made open by researchers from a certain institution that are reused in open papers.
For more details, see the last blog post on queryng FREYA PID graphs
As a sidenote, Jonathan Rochkind argues that a lot library linked data that focused on converting library data in catalogues were barking up the wrong tree, because most of the data regarding title, author and even subject relationships were already out there in the web, so converted it to linked data was of little value to users. Perhaps the only valuable data that could be shared and linked up would be holding data and format data (i.e where something is available as a book, ebook, DVD but unfortunately is a very difficult question to answer using MARC). This argument does not seem to apply for PID research graphs at least with the current interest in the Scholarly communcation system.
Going beyond the research domain - a Cross domain knowledge graph ?
Still as interesting and useful as a Scholarly research graph idea is with properties relating to research metadata and relationships between research related entities , such graphs can only answer certain questions relating to research inputs, outputs, relationships and flows.
Can we go further and create and use large scale cross domain linked data graphs (also sometimes called knowledge graphs) beyond just the domain of research?
How about the bibliometric data available in library catalogues? Should we convert our data in there to linked data formats to be consumed by other users outside the library?
As you have seen earlier one argument is traditional linked library projects that attempt to leverage library data in MARC to linked data formats like Bibframe haven't seen much success because much of the data represented in library catalogues are not that useful and are already out there (e.g. title, author) , still organizations like OCLC , Library of Congress have been trying to convert MARC into linked data with Bibframe, there is some movement on the side of library system vendors like Exlibris, and Ebsco acquired Zepheira - a linked data infrastructure provider in 2020,
On the other hand, outside the library industry we have been seeing a swing towards trendy "Knowledge graphs", coupled with the rise of schema.org.
Today, Google Knowledge Graph is prettyy much the flagbearer and face for Knowledge graphs for many.
After all, the lure of getting Q&A type queries in Google to display Knowledge panels on Google search result pages, drawn from Google's Knowledge graph is too tempting to ignore.

Google Knowledge Graph surfacing my profile!
That said this has led to confusion for less technical people like me on wondering about the similarity or differences between these knowledge graphs and the traditional linked data projects.
For what's it worth it seems to me while linked data has a fairly concrete definition, i.e structured data expressed in RDF triples, Knowledge graph tends to have a looser definition. Though at the broad level, they tend to be similar - graphs with entities connected to each other via relationships or properties.
Of course, both traditional linked data models and Knowledge graphs can be implemented to cover only limited domains.
But arguably, the value and interest in Google Knowledge graph or knowledge graphs like DBpedia lies in the fact that they span almost all domains.
Unfortunately, while it is fairly easily today to create a research graph with a few defined relationships (is_cited_by, is_author_of, is_title_of etc), a linked data graph of concepts covering the general domain runs into the problem of needing to have a lot of sufficient and interesting data available and linked in the graph before querying the Knowledge graph can become really powerful.
The larger the domain covered by a linked data model, the more sparse the graph will be due to lack of information but this is where Wikidata comes in .
Wikidata the killer app?
Wikidata which is a sister project of Wikipedia, can be thought of the structured data that provides some of the information (infoboxes) displayed on Wikipedia .
What is Wikidata
Wikidata allows you to construct statements about entities using Triples and to record provenance for such statements or claims.
As befits a Wikimedia project and sister organization to Wikipedia, all data on Wikidata can be collaboratively edited.
The problem with trying to create a large cross domain knowledge graph like Wikidata is you have a chicken and egg problem if you need people to populate the data.
After all if you want to attract users to populate the graph with more triples it would be easier of the graph already has enough information to generate reasonable results from queries users are making.
If there isn't much information in the system it won't be very useful and most users will not come into the system or want to contribute.
Wikdata might be closest to solving the problem thanks to a extremely user friendly wikidata interface that allows user to do linked data triples without knowing they are doing that , paired with a equally friendly SPARQL query system that allows users to create useful queries.
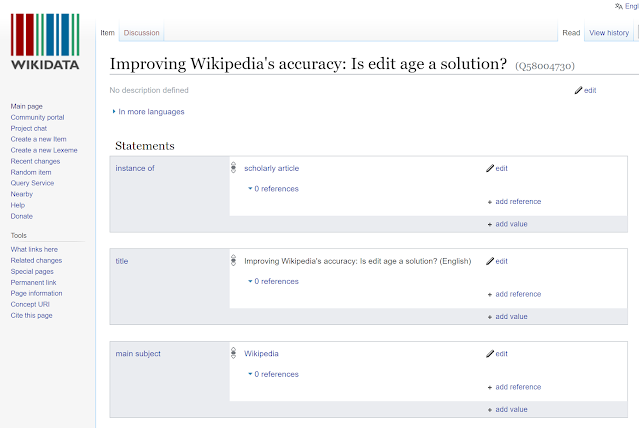
Wikidata entry of a journal article
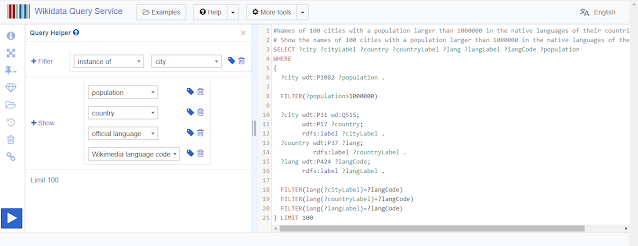
The usefulness of Wikidata
Fueled by volunteers and bots, Wikidata has made a good attempt at populating triples in the Wikidata system in an open manner, which combined with SPARQL queries allows you to do queries over the triples available for answers that would be hard to retrieve otherwise.
For example, with this query, you can try searching for the answer of "Number of ministers who are themselves children of a minister, per country"
Wikicite the section of Wikidata that focuses on developing open citations and linked bibliographic data in Wikidata - currently covers over 35 million Scholarly articles, and 174 million citations. This is represented in 11,406 million triples.
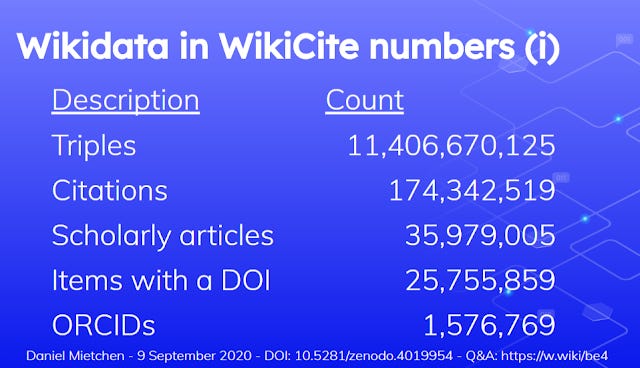
One can think of this as the part of Wikidata that corresponds to the PID research graph mentioned earlier.
Similarly given such data one could do SPARQL queries like "Show top 10 cited female authors with citzenship Denmark" .
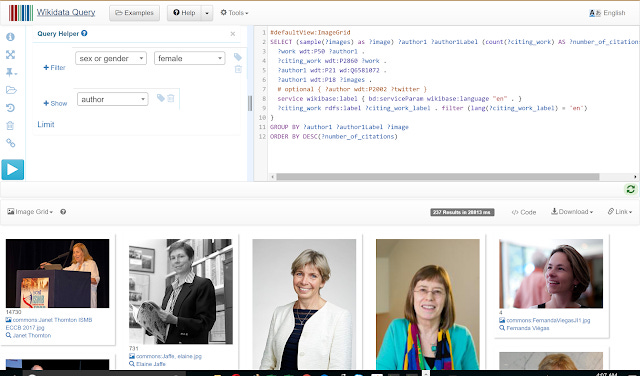
SPARQL search on Wikidata for top 10 cited female authors in Denmark
For those not familar with SPARQL applications like Scholia exist that provide a user friendly interfacce that run canned queries in the background to produce interesting visualizations.
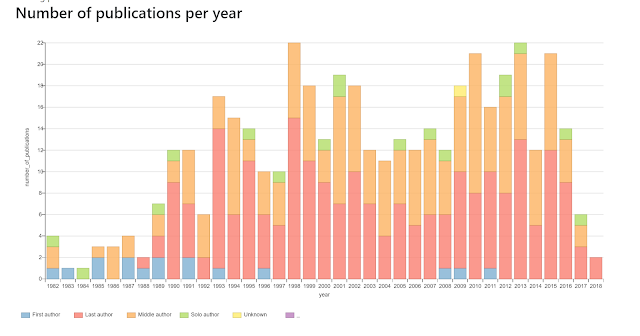
A standard visualization of paper publication years generated by Scholia
These can produce standard bar graph type visualizations but because Wikidata includes very interesting properties beyond the usual ones found in PID research graphs, it opens the opportunity for interesting visualizations.
For example, Wikidata collected the doctorial advisor (P184) property for phds, so this can be leveraged to show reallyinteresting visualizations such as "academic trees" showing Academic genealogies, tracing the impact of intellectual traditions as long as the researchers have been linked using doctorial advisor (P184) property,
Organizations have been quick to note the rise of Wikidata as a linked data source and in a 2018 survey by OCLC Research of Linked data inplementers , Wikidata quickly jumped to the 5th most important source of linked data.
Organizations such as the Biodiversity Library and the National Library of Wales have all started to expose and link their metadata to Wikidata.
Also organizations like OCLC, National Library of France are not only contributing data to Wikidata but are also adapting the user friendly software Wikibasem the software behind Wikidata for production cataloguing workflows!
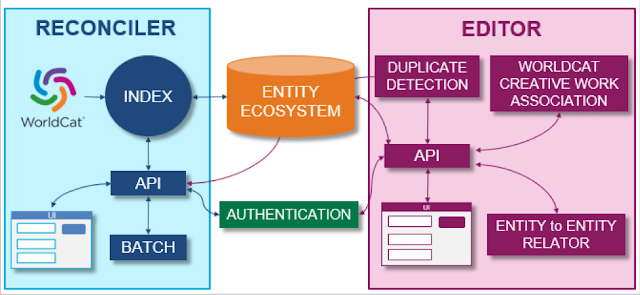
OCLC Linked data Wikibase prototype
Direct applications to searching for relevant documents
To many of our users, the applications above would be very alien to them since they are more used to doing keyword searches to look for books, articles and other Scholarly content on the relevant topics they are interested in.
Are there any discovery applications that are directly targetted at them? I'm currently familar with two commerical systems that try to do this.
The first is Yewno Discovery which provides a brand new interface to search searching by concept.
However the learning curve using such systems might be high as you may have to adopt a different mental model using this search.
Ebsco an existing discovery vendor has instead developed the Concept maps feature (currently in beta) to supplement the usual keyword searching in Ebsco discovery service.
This works off the existing Ebsco discovery service where you enter keywords and the system tries to map your keyword to concepts. From there you can choose to jump to the concept maps interface.
Once in the concept map, you can use relationships between concepts to better control the type of concepts you are looking for to add to the search builder (using Boolean).
This helps with various things like exploration of concepts and disambiguation of concepts when doing keyword searches.
How useful will this be? I suspect it depends on the richness of the concept map, and how well keywords map to those concepts. I intend to review this in future blog pots.
Conclusion
A lot of these applications seem promising, but the proof of the pudding is in the eating.
I'll end again with the challenge Dorothea Salo made in 2013 to linked data projects.
Wow me with linked data. Wow librarianship with linked data!
My third challenge, and I’m quite hopeful about this one, actually—make me say “wow!” about something you did with linked data. And why stop at me? I challenge you to wow all of librarianship with linked data!


