
[OA week 2020] - Creating a free and beautiful auto-updating dashboard for tracking Open Access rates for your institution using Lens.org

So it is Open Access Week 2020, while I write quite a bit on Open Access and Open Data, I don't often post specifically for Open Acess Week.
One exception was 2017's My reflection on my journey in open access or Can you be a librarian without being an open access advocate? where I shared my fears about how the rise of open access might slowly reduce part of the importance or value of academic librarianship (the part that focuses on providing access to resources behind paywalls what Lorcan Dempsey's calls outside-in) and the difficulties of adjusting to a post OA world and wondering if I should feel guility about that.
I concluded by saying that
In any case, my thinking currently is open access is inevitable now, so arguing whether you are an advocate or not is pointless. As a librarian we need to prepare now for it's coming and influence it in a way that leads to the maximum benefits for our users and maybe even with a little bit of consideration for ourselves.
It's 2020, and my views haven't changed that much, though I have become more and more aware of the innovation that can be unleashed the more open data (metadata and full text) is available particularly in the research tools space.
Also it is important to note my "inevitable" above doesn't mean immediate.
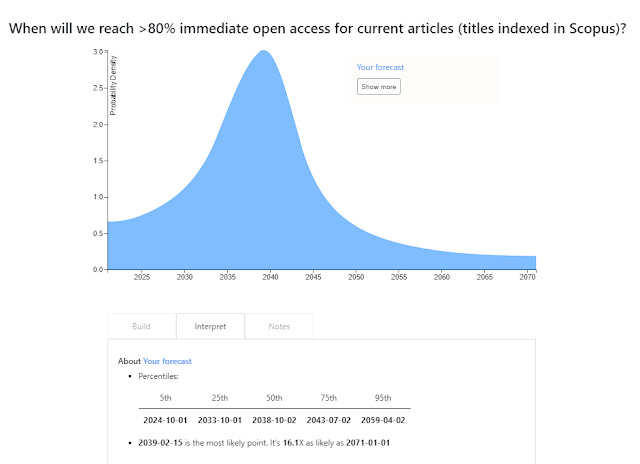
https://elicit.org/builder/zy2VjI-zQ
Above shows my totally unqualified wild guesses on the year where the condition "80% of articles indexed in Scopus for that year is made immediate Open Access" is reached, which I obtained by entering my guesses into the free tool Elicit
50 percentile turns out to be set to 2038, so I believe we have 50% chance of hitting this target within the next 18 years, while the chance of hitting this target by 2033 is 25%. No doubt some will think I am pessimistic , others optimistic! Feel free to try your own forecasts.
But enough of that, I'm no futurist nor am I a deep insightful thinker, but what I do is play with tools. So for Open Access Week 2020, let me share with you how to quickly and simply create a nice dashboard for tracking your institution's OA rate using Lens.org.
Creating a simple beautiful auto-updating OA dashboard for your institution or country using Lens.org
I have raved a lot about Lens.org since I discovered it a couple of years ago. It is a full featured academic search engine with one of the largest source of academic data being drawn from open academic sources from Microsoft Academic , Crossref, Pubmed to Unpaywall combined with powerful boolean searching features.
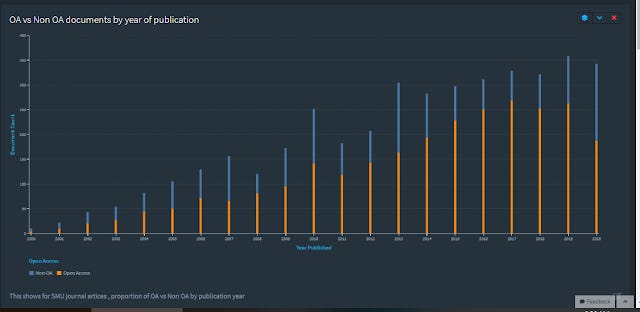
But for this blog post, I would like to praise the excellent visualization features that are easily among the best I have seen that you can get for free.
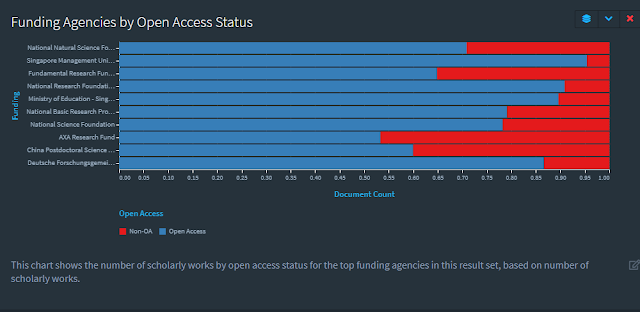
Imagine you are asked by a senior University administrator how much of your University's output is currently made open access? Or if you wish to track if your researchers are complying with funder requirements.
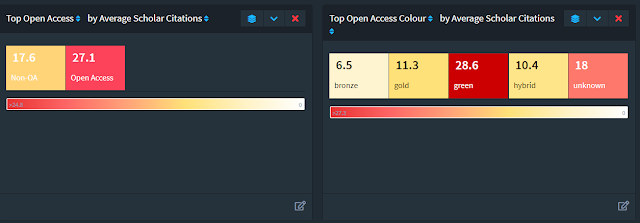
How about if you wanted to see the average citation count for articles available open access vs those that were not or between OA colors aka citation advantage?
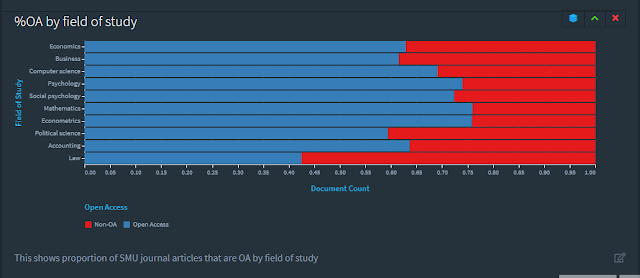
Wouldn't it be nice to have auto-updating dashboards like this for the low price of free?
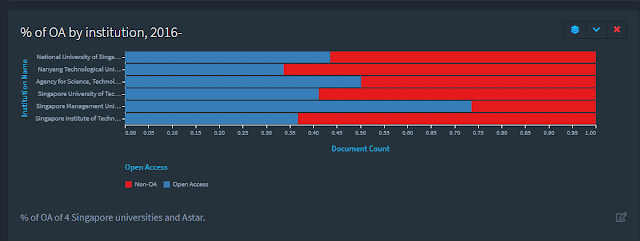
Or this
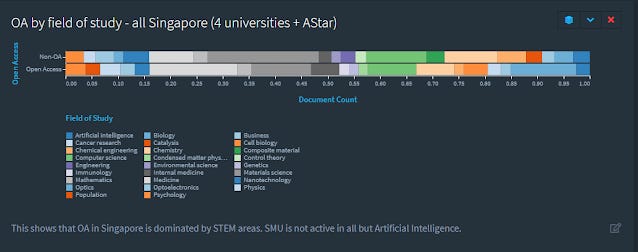
or this
or this
The dashboard can be made totally private (shareable only to those you wish) or can be made totally public - For example try this link - https://link.lens.org/FCuED94Ta1b
Of course, you can do comparisons at the country level or with only select institutions. Like the public dashboard that I created at https://link.lens.org/Jqz0Sv6winb
Steps to create these visualizations
Interested? I will run you through briefly the main steps needed.
Step 1 : Create your own account at Lens.org. I recommend you create it via ORCID.
Step 2 : Run the search query you need.
For the first example dashboard , it is pretty straight forward, run a search query that covers the institution you are in using the affiliation field. In my search query, I also restrict it to publication type =Journal article and the start publication year.
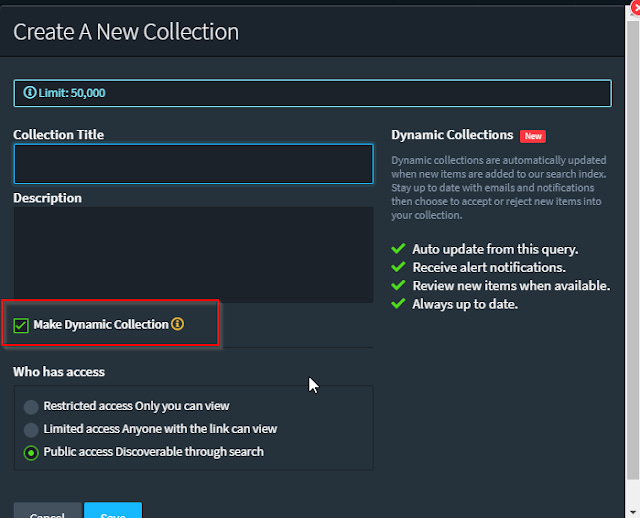
Step 3 : Save the query as a dynamic collection
Click on "Save collection"
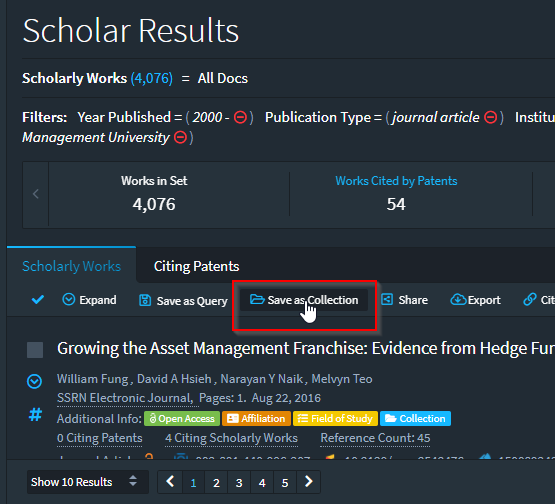
In the resulting popup , give nice descriptive names to the collection and set the sharing options for the collection you want.
Be sure to select "Make Dynamic Collection" , this will ensure your collection will continue to autoupdate as new articles come in.
Note: Dynamic collection is a new feature as of Oct 2020.
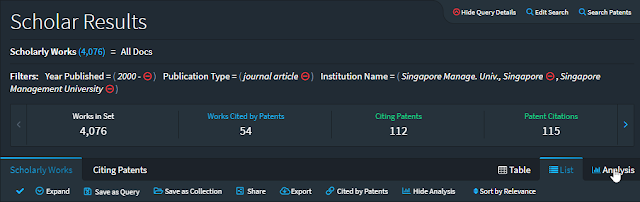
Step 4 : Create a dashboard based on the collection by clicking on the analysis tab.
Step 5 : Create the visualizations and save the dashboard
The rest should be simple enough.
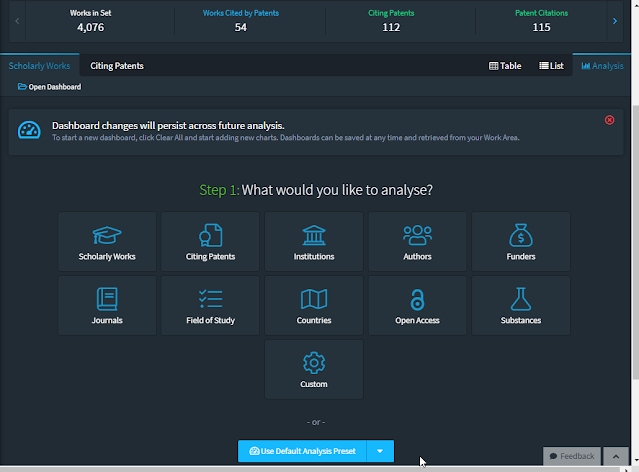
You can look at suggested default visualizations by topic e.g. Open Access, or create on "Custom" and play with the different visualization types and play around with the fields you can put in them.
Once you are happy with the results, save the dashboard.
Note, a shortcut method to reuse the same public shared dashboard but on a different query.
For example click on https://link.lens.org/FCuED94Ta1b , and
1. Click on the filter icon on the left side of the screen.
2. Clear the institution filter and add your institution instead.
3. The dashboard will update using the new search query instead.
Some less obvious visualization tricks
1. Using “Restrict to Filtered value” to only show the institutions or values you are interested in.
Say you are interested in comparing Institution X, Y and Z and you do a search query that is filtered to includes only papers where the authors can come from any of these three institutions aka you filter to those institutions
But when you visualize say OA ratio per institution, you get other institutions starting to appear.
In my example below, even though the query was set to 4 Singapore institutions + A*Star, when I did the initial visualization I got institutions that I was not interested in such as Chinese Academy of Science, Boston Children Hospital appearing.
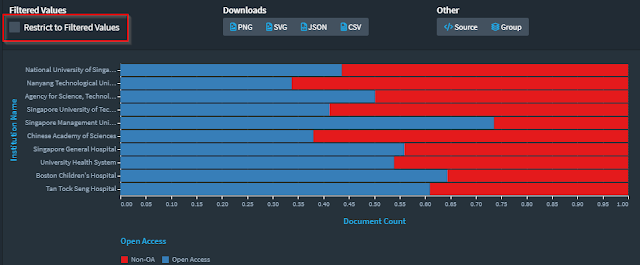
This is because researchers from those institutions are coauthors of papers of the 4+1 Singapore institution authors so they appear as well. The trick to hide them is to check “Restrict to Filtered value” to make those institutions disappear.
2. Use grouping to clean up dirty labels
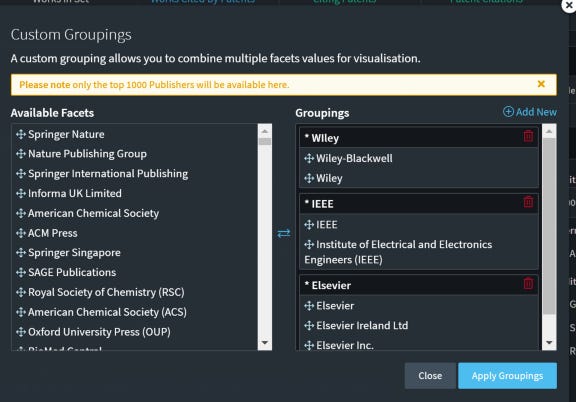
Often the data isn't very clean. For example, the Funder or Publisher name is often uncontrolled and when you visualize you get very ugly looking labels.
Fortunately you can do custom grouping. In the example below for funders or publishers, you should first set the limit to the highest which is 1,000 then click on grouping to work on the top 1,000 labels.
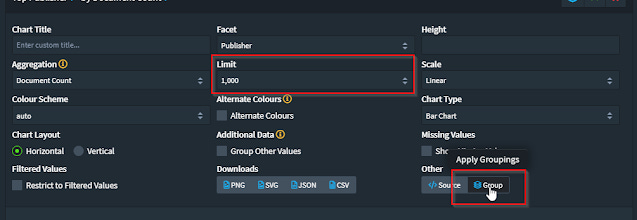
You can do custom grouping of the top 1,000 labels manually or using the "auto-fill" function but that doesn't always work well in my experience.
Conclusion
Once you start playing with Lens.org and get familar with it, it becomes quite easy to use and the possibilities are nearly endless. It's an amazing tool for something that is totally free.
The main drawbacks of using Lens.org is that compared to data from Scopus or Web of Science, the cleanliness of the data you get from Lens.org (which itself is drawn from sources like Microsoft Academic Graph, Crossref etc) is still quite unstudied.
Like most systems today including Web of Science and Scopus, Lens.org also relies heavily on Unpaywall , to determine the Open Access status of papers. As such, it might be a good idea to ensure your institutional repository contents (typically a rich source of Open Access content for your institution) is properly indexed by unpaywall. See my recent experience about this.
On the other hand, you do get a more comprehensive coverage instead of the selective journals indexed in Scopus or Web of Science.
Lens.org may also be slow to update because it is an aggregator of other sources, but I think for this particular use case, this probably isn't fatal.